From Ignored to Indispensable: The Proven, Step-by-Step CX Insights Mastery Blueprint in < 6 Days!
This free, 6-day email course walks through a proven process to turn customer feedback into career growth, strategic influence, and a seat at the executive table in 30 days.
Most companies waste time fixing the loudest complaints instead of what actually hurts their NPS.
This article shows you how to identify which issues are really driving customers away (not just annoying them), focus on problems affecting your most valuable segments, and prioritize fixes you can actually execute quickly.
One retailer cut their analysis time from 7 days to 5 hours and found $4.8M in opportunities by stopping the guesswork and following this framework.
7 days → 5 hours. 91% faster. $4.8M captured.
That's what a large grocery retailer we work with achieved when they stopped chasing volume and started fixing impact.
You'll learn the exact framework that delivered those results: a proven method to pinpoint what's dragging down your NPS and recover points fast.
After a system migration, complaint volume surged. Service issues dominated every dashboard. Leadership mobilized resources for what looked like an obvious crisis.
They ran an NPS root cause analysis in Thematic. The findings surprised them.
Baggage handling wasn't mentioned most frequently. It destroyed NPS and customer lifetime value disproportionately.
80% of those issues were operationally fixable with existing resources.
Orion Air refocused. They fixed specific baggage handling processes first.
Result: 1.6-point NPS increase in that segment alone, contributing to 13% overall improvement with measurable revenue gains.
Volume lies. Impact tells the truth.
The IST framework: Impact, Segment, Trend
Jumping from "what's loud" to "what to fix" wastes weeks.
Follow this order instead:
Impact: Quantify score damage by theme
Segment: Find where revenue risk concentrates
Trend: Identify what's accelerating versus stabilizing
This sequence holds up in executive reviews. More importantly, it leads to the right fixes fast.
Atlassian used this exact order to triage 60,000 monthly feedback items. They went from debating priorities for weeks to identifying top fixes in days.
Step 1: Impact analysis (measure damage, not mentions)
Stop counting comments. Start measuring point drag.
The formula:
Impact = Overall average NPS – Theme-specific average NPS
Customers who mention high-impact themes score you far lower than everyone else. Mention rate is irrelevant.
Real example from Orion Air:
Theme
NPS Impact (pts)
Fixability
Service issues
–0.6
Mixed
Baggage handling
–1.6
80% operationally fixable
Baggage handling wasn't mentioned most frequently. But it had the biggest negative impact.
OrionAir prioritized it first.
Result: 1.6-point NPS recovery, contributing to 13% overall NPS improvement.
Priority starts where point drag meets fixability. Not where volume peaks.
Volume-based triage sends teams after problems that barely move scores. Impact-based triage shows you which 3 themes to fix first to recover the most points.
Step 2: Segment analysis (find who's actually at risk)
After sizing impact, locate where risk concentrates.
Slice impact by:
Customer tier/plan
Lifecycle stage (new versus existing)
Region or market
Product line
Channel
The same theme might cost you –2 points overall but –8 points in high-value segments.
With 10 million consumers, 500,000 shoppers, and 40,000 retailers, they used Thematic segmentation to see how identical complaints affected each audience differently.
When personal shoppers' apps crashed, the impact varied by segment. Instacart needed specifics:
Was it happening during critical moments in the delivery chain?
Which sub-themes mattered most for shopper earnings and retention?
Thematic segmentation revealed where the problem hit hardest. This allowed them to prioritize fixes that protected their highest-value segments first.
Example segment impact table:
Segment
Impact (pts)
Coverage (%)
Revenue at risk
Enterprise tier
–4.2
12%
$2.1M
Mid-market
–2.8
35%
$890K
Small business
–1.1
53%
$340K
Highlight the worst cell. Start there.
Fixes should protect customers who matter most, not those who complain loudest.
Step 3: Trend analysis (is it accelerating or stabilizing?)
Momentum changes everything.
Compare 30/60/90-day windows. Calculate a simple slope. Then classify:
Accelerating: Act now. Costs compound daily.
Stable: Monitor or bundle with related fixes.
Declining: Deprioritize unless segment value is unusually high.
Set a minimum coverage threshold (3-5%) to avoid chasing statistical noise.
Greyhound used this approach to spot accelerating issues in real time. They went from waiting 3-4 weeks for compiled reports to identifying problems within 2 minutes, allowing them to fix issues before they impacted revenue.
Prioritize by Impact × Segment value. Use Trend as your brake or gas pedal.
An issue with –3 impact that's accelerating beats a –4 issue that's declining. You're preventing future damage versus cleaning up past problems.
Prove it to executives (in one meeting)
When NPS drops, leaders want two things: what changed and proof it's real.
Turn raw feedback into an exec-ready attribution story with three visuals.
Visual 1: Coverage (context check)
Show the share of total feedback for each theme.
This prevents overfitting to outliers and sets proper context for your analysis.
Visual 2: Significance (stability proof)
Include sample size (N), standard error, 95% confidence interval, and a three-period sparkline.
This proves the trend holds and isn't just noise.
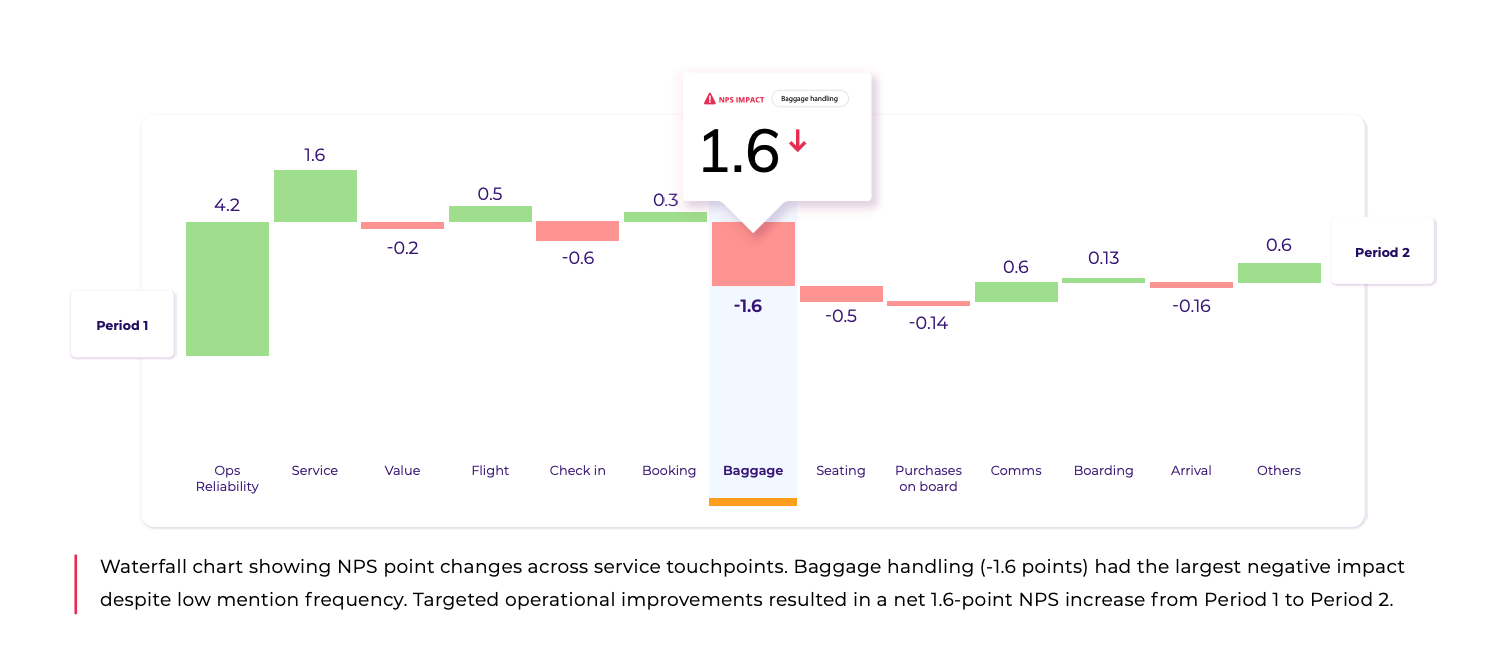
Visual 3: Attribution (score-change waterfall)
Tie score movement to themes using a period-over-period NPS waterfall. Label positives, negatives, and net change.
Atlassian proved this works with 60,000 monthly feedback entries across products.
They filtered by product line to isolate impact. Tracked stability across periods to rule out noise. Linked pain points directly to metric change.
Teams could distinguish signal from noise instantly, cutting debate cycles and aligning priorities across product groups.
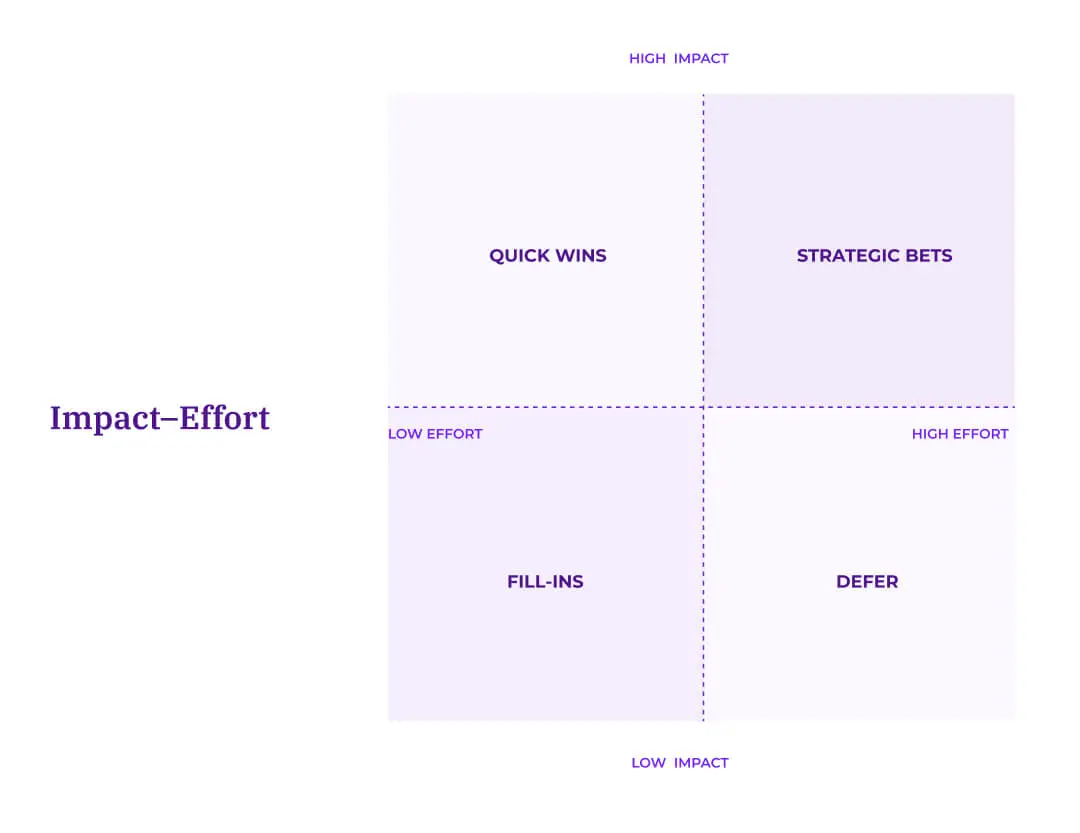
The priority formula (one score to end roadmap debates)
Strategic bets: High impact, high effort (plan and resource)
Fill-ins: Low impact, low effort (batch together)
Defer: Low impact, high effort (deprioritize)
Priority formula in action
Orion Air used this formula to prioritize their baggage handling fix. Despite lower mention volume, the priority score was 3.2x higher than service complaints due to impact and fixability. They shipped it first and recovered 1.6 NPS points. This formula converts subjective arguments into objective math.
When your VP of Product asks "why are we fixing this first?" you have a defensible answer.
Your 5-day NPS root cause analysis plan
Follow this structured, repeatable plan.
Timeline
What to do
Days 1–2: Data and setup
Pull 90 days of NPS/tNPS/CSAT scores with comments. Join with customer metadata (tier, lifecycle stage, region, product line, channel).
Days 3–4: Run IST analysis
Compute Impact per theme. Slice by Segment to find high-value risk pockets. Mark Trend direction (accelerating or stabilizing).
Day 5: Top 3 and action plan
Score themes using Priority = (Impact × Segment Value) ÷ Effort. Build one-pager with top 3 fixes, assigned owners, deadlines, and expected score deltas.
Week 2+: Execute and validate
Ship quick wins first. Re-measure after 30 days. Adjust roadmap based on verified deltas, not assumptions.
Days 1-2: Data and setup
Pull your last 90 days of NPS/tNPS/CSAT scores with associated comments. Include tickets and reviews if available.
Join scores with context metadata:
Customer tier
Lifecycle stage
Region
Product line
Channel
This segmentation unlocks the insights that matter.
Days 3-4: Run IST analysis
Compute Impact per theme (in points). Slice by Segment to find high-value risk pockets. Mark Trend direction (accelerating or stabilizing).
This is where volume-based assumptions collapse and real priorities emerge.
Day 5: Top 3 and action plan
Score every theme using the priority formula: Priority = (Impact × Segment Value) ÷ Effort
Produce your top 3 fixes with:
Assigned owners
Deadlines or SLAs (Service Level Agreements)
Expected score deltas
Build a one-pager with coverage charts, significance data, waterfall attribution, ranked priorities, and timeline.
Week 2+: Execute and validate
Ship quick wins first. Re-measure impacts and trends after 30 days. Adjust roadmap based on verified deltas, not assumptions.
A large grocery retailer we work with followed this exact plan. They went from 7 days of manual analysis to 5 hours of automated insights, uncovering $4.8M in revenue opportunities within their first investigation cycle.
How teams run NPS root cause analysis in Thematic
Stop wasting weeks tagging comments manually.
Thematic delivers exec-ready NPS insights from raw feedback in 10 minutes.
Lee King, Head of Insights at LendingTree, explains:
"Thematic works straight out of the box. I can show the business promoters and detractors, and quantify the drivers. Then, it's the richness of the qualitative comments that builds an understanding of how the customer feels and experiences."
Your NPS root cause analysis checklist
Fix what moves the score. Protect customers who matter most. Act on momentum.
Fix what moves the score. Protect customers who matter most. Act on momentum.
Impact: Quantify score damage by theme
Segment: See where revenue risk concentrates
Trend: Act first on accelerating issues
Rank: Use Priority = (Impact × Segment Value) ÷ Effort
Prove: Show coverage, significance, and score-change waterfall
That's how you turn NPS analysis into retention and protected revenue.
See exactly what's killing your NPS score
Bring your last 90 days of feedback to a Thematic demo. We'll run a live root cause analysis on your data.
You'll see your top 3 fixes ranked by priority score and the fastest path to measurable NPS lift.
No generic slides. Just your themes, your segments, your priority scores.
Maurice Fitzgerald, VP Customer Experience at Hewlett-Packard, has this to say about Thematic:
"The results are the best I have seen from any software solution I have tested, by a clear margin."
Request a demo of Thematic's Customer Intelligence Platform
Thematic turns fragmented feedback into one consistent source of customer truth — so every team acts on the same customer story. Up and running in days, not quarters.
Thank you! Your submission has been received!
Oops! Something went wrong while submitting the form.


.jpg)


.webp)


