Beyond Traditional NLP: How LLMs and Generative AI Are Transforming Text Analytics
How LLMs and generative AI are delivering deeper, more accurate customer insights from text data without the constant manual updates required by traditional NLP.
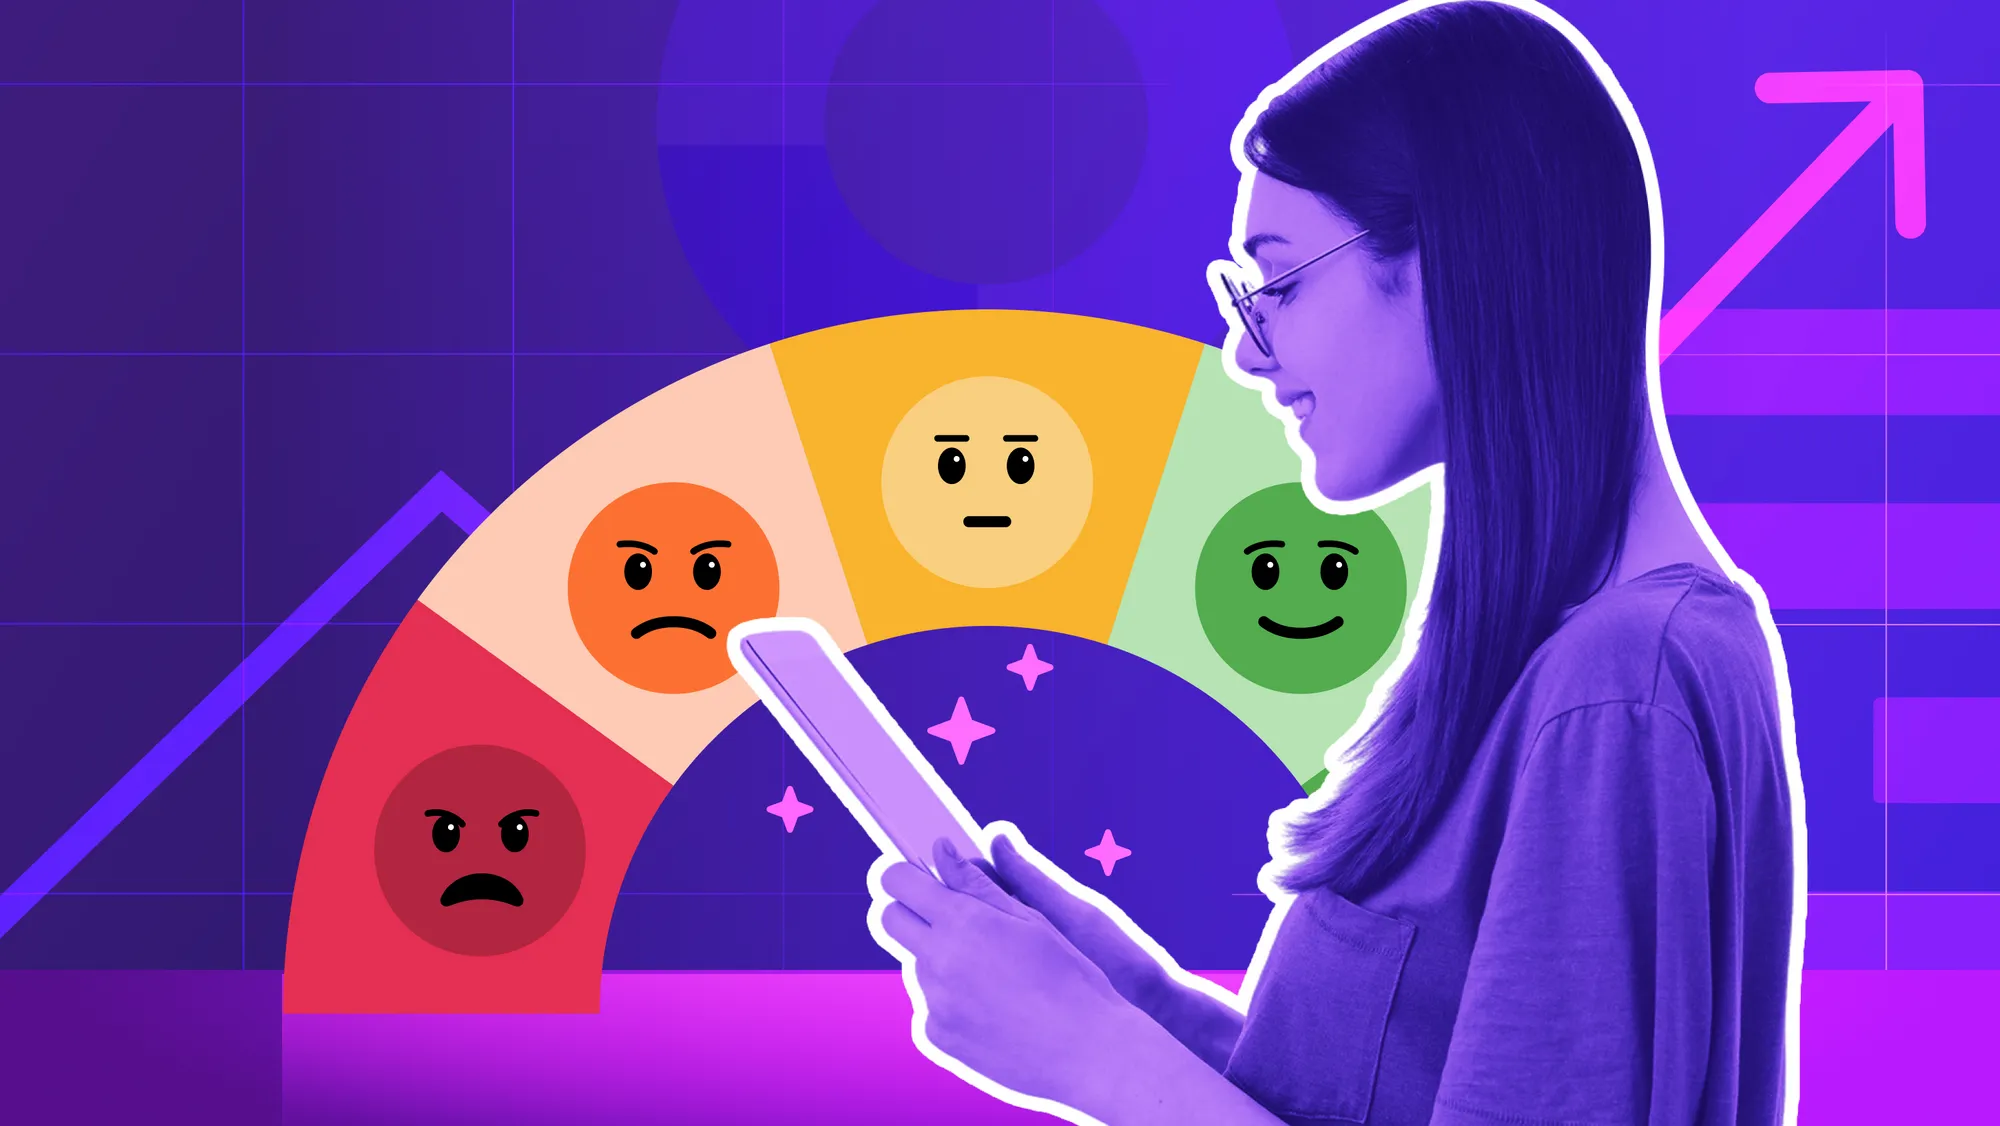
A sentiment score quantifies emotional tone in feedback on a scale (typically -100 to +100)
Thematic uses advanced AI with transparent, human-in-the-loop control (no black-box mystery)
Benchmark against your history, industry averages, and competitors to know what "good" means
Use scores to spot pain points, set alerts, prioritize fixes, and track business impact
One in three consumers abandon brands after one bad experience, so catch problems early
Sentiment scores turn thousands of messy comments into trackable, actionable KPIs
When you read through customer feedback, you can often tell if the tone is positive or negative. But how do you quantify those feelings across thousands of comments?
You've got 10,000 survey responses sitting in a spreadsheet. Reading them all isn't practical, and your executives need answers about declining satisfaction scores this week.
One retail company faced this exact challenge. They were drowning in feedback but had no way to measure customer emotion at scale.
They implemented sentiment scoring and discovered something critical: their Net Sentiment had dropped 15 points in just two weeks. This early warning helped them catch a checkout bug before it tanked their NPS.
The difference wasn't working harder. It was quantifying emotion so they could act fast.
Here, you’ll see how to use sentiment scores to catch problems early and improve customer experience. You'll learn what a sentiment score is, how it's calculated, how to benchmark it, and how to use it to spot issues before they become churn.
For enterprise CX and insights teams, sentiment scoring serves as a critical component of your feedback intelligence layer. It sites on top of existing tools like Medallia, Qualtrics, and contact center platforms to provide unified emotional analysis across all customer touchpoints.
What is a sentiment score?
A sentiment score is a numerical rating that represents the overall sentiment or emotion expressed in a piece of text.
In other words, it tells you at a glance how positive, negative, or neutral a customer comment is.
This score comes from sentiment analysis algorithms, which evaluate the words and context in feedback to determine emotional tone.
An enthusiastic comment like "This product is fantastic!" gets a high positive score. "The support was terrible" scores quite negative. Neutral statements land somewhere in the middle.
How Sentiment Scores Are Expressed
Sentiment scores are often expressed on a scale.
Many systems use -100 to +100 (with 0 as neutral). Others use 1 to 5, 1 to 10, or simple percentages.
The idea is the same: higher scores mean more positive sentiment, lower scores mean more negative sentiment.
These scores can be calculated for individual pieces of text (like a single survey response) or aggregated across many comments to gauge overall sentiment. This process is central to sentiment analysis of reviews or feedback.
This is particularly relevant in review analysis, where transforming unstructured customer reviews into structured insights can guide product development and enhance customer experience.
Unlike a simple thumbs-up or thumbs-down, a sentiment score captures degrees of positivity or negativity.
This nuance matters.
Not all positive feedback is equally enthusiastic, and not all negative feedback is equally severe.
What sentiment scores reveal (and what they don't)
A sentiment score focuses on polarity (positive vs. negative) and intensity of emotion. It won't tell you why customers feel that way, just how they feel.
For example, sentiment analysis might reveal customers are unhappy (low score). But you'd use thematic analysis or topic analysis to find out what they're unhappy about (e.g., pricing, support, or a specific feature).
Still, as a metric, the sentiment score is a handy barometer of customer mood. It complements other CX metrics like CSAT or NPS.
To delve deeper into the nuances of customer feedback, qualitative data analysis can uncover underlying themes that quantitative metrics miss.
💡
Drill Down: Sentiment analysis tells you how customers feel, but not why. To uncover root causes—like issues with pricing, support, or specific features—you need thematic or topic analysis. Thematic's platform provides both: it quantifies emotional tone through sentiment scoring and identifies recurring themes in feedback, giving you a comprehensive view of customer insights.
Why sentiment scores matter
Quantifying sentiment turns messy feedback into clear priorities. Instead of just reading comments and getting a gut feel, CX teams can track sentiment as a KPI.
Customers who have a positive experience are willing to spend up to 140% more than those who had a negative experience.
On the flip side, bad experiences drive even loyal customers away. In fact, 43% of customers have left a beloved brand after multiple poor experiences.
With a number attached to sentiment, you can measure experiences and watch for warning signs.
If your average sentiment score on support tickets drops sharply one week, that's an early red flag. Something's wrong in the support experience.
Without a quantified score, you might not catch that trend until churn or complaints show up later.
A sentiment score acts as a real-time indicator of customer mood. You can gauge satisfaction right now and track it over time.
Enterprise Sentiment Analysis Software
See How Thematic Delivers Transparent, Auditable Sentiment Scoring for CX Teams
Sentiment scores are calculated using natural language processing (NLP), technology that helps computers understand human language.
The algorithms analyze text for positive, negative, or neutral cues to understand feedback or customer sentiment.
There are a few approaches, ranging from simple to sophisticated:
Rule-based systems
Early sentiment analysis used dictionaries of positive and negative words.
For example, words like "great" or "excellent" might add +1. "Terrible" or "poor" add –1.
The system totals up the values to get a score for the text. This is straightforward but can miss context. For example, sarcasm or negation like "not great."
Machine learning classifiers
Most modern systems use AI models trained on examples of text labeled by sentiment. These models learn the nuances of language, so they consider word context and phrases.
For instance, they know "not great" is negative despite the word "great" being positive.
Traditional machine learning models (like logistic regression or SVMs) improved accuracy over simple rules. They learned from large datasets of labeled feedback.
Advanced AI and large language models
Recently, large language models and deep learning have revolutionized sentiment detection. This enables more nuanced and accurate analyses through AI sentiment analysis.
Advanced AI models (like GPT-4 and BERT, the same technology powering ChatGPT) can interpret tone, context, and even sarcasm with far greater accuracy. These AI models effectively "understand" language at a deeper level. This allows for research-grade sentiment scoring. They pick up on subtle cues.
For example, "I guess this will do" might be classified as mildly negative. Despite no overtly negative words, the model grasps the reluctant tone.
Thematic calculates sentiment scores using advanced large language models that achieve research-grade accuracy. It provides transparent workflows that let analysts verify and refine scoring. This combines the speed of AI automation with the rigor of human validation.
Sentiment Score Calculation Methods Comparison
Method
Description
Pros
Cons
Rule-Based
Uses word lists with fixed scores.
Fast, simple, transparent.
Misses context and sarcasm.
Machine Learning
Trained on labeled data to learn patterns.
More accurate, handles context.
Needs training data, less flexible.
Advanced AI / LLMs
Uses models like GPT or BERT to infer meaning.
Most accurate, captures nuance.
Requires more compute, less transparent.
💡
Regardless of the method, sentiment tools turn text into positive, negative, or neutral scores—automatically handled behind the scenes.
The "net sentiment" formula
When aggregating sentiment, organizations often use a Net Sentiment Score.
It's analogous to a Net Promoter Score but for sentiment.
The net sentiment formula is simple: subtract negative mentions from positive ones, divide by total mentions, then multiply by 100.
This gives you a score between -100 and +100.
Here's the formula:
Net Sentiment = ((# of Positive mentions – # of Negative mentions) / Total mentions) × 100
For example:
If out of 1,000 feedback comments, 600 are positive and 200 are negative (the rest neutral)
Net Sentiment = ((600 – 200) / 1000) × 100 = +40
A positive net sentiment means you have more positive than negative feedback overall. A negative net sentiment indicates more negativity than positivity.
This metric strips away ambiguity by boiling sentiment down to a single number.
Importantly, neutral feedback is counted in the total but doesn't affect the net score except by influencing that percentage. Many VoC programs report net sentiment as an easy health check metric.
For instance, a net sentiment of –10 would be a serious warning sign. It indicates widespread unhappiness (more negatives than positives overall).
On the other hand, a net sentiment of +50 would indicate a strong positive tilt in customer feelings.
Companies sometimes set targets around improving net sentiment, similarly to how they set NPS targets.
It's worth noting that sentiment score ≠ satisfaction score.
Sentiment is derived from textual feedback and reflects emotional tone. CSAT or NPS is explicitly given by the customer in a rating scale. However, they often correlate.
In fact, some experts consider net sentiment a useful real-time complement or even an alternative to NPS. It captures unprompted customer feelings from comments (the "voice of customer") rather than from survey ratings.
The best practice is to use them together. Sentiment analysis explains the why behind a low NPS or CSAT by analyzing the feedback comments. It gives an early indication of issues even before scores like NPS dip.
💡
To delve deeper into the science behind sentiment analysis and understand how Thematic's AI models interpret customer feedback, explore our AI Approach.
How to benchmark sentiment scores
Benchmarking gives your sentiment scores context by comparing them to your past performance, industry standards, or competitors.
Once you know what "good" looks like, you can track progress and spot issues early.
1. Your own data
Start with your historical performance.
Is your sentiment score improving month over month?
A jump from +20 to +30 is good. A drop to +10 signals a problem.
Internal benchmarks help track progress and the impact of changes (like product launches or outages).
2. Industry benchmarks
Compare your scores to others in your space.
According to Qualtrics XM, grocery brands average 71%. Car rentals hover around 52%.
What's "good" varies by sector, so use industry data to see if you're ahead or behind.
3. Competitive benchmarks
You can analyze competitors' public feedback (like app reviews or social posts) with the same sentiment tools.
If your rating is 4.2 and theirs is 3.8, that's an edge.
Just be sure to compare similar channels and contexts.
4. Link to other metrics
Some companies correlate sentiment with NPS or star ratings.
For example, you might learn that a sentiment score above +25 aligns with a strong NPS.
That gives you a clear internal benchmark to watch.
Benchmark Types Comparison
Benchmark Type
What It Compares
What to Look For
Example
Your Own Data
Past vs. present scores
Trends over time
+20 last month → +30 now = improvement
Industry Benchmarks
Peers in your vertical
Position relative to sector norms
Retail avg = +40; you're at +50 = strong
Competitor Benchmarks
Public sentiment on similar products
Relative customer happiness
App store avg: them = 3.8, you = 4.2
Other Metrics
Sentiment vs. NPS, CSAT, star ratings
Correlations and threshold alerts
Score > +25 = NPS ~50 for your org
💡
Tip: Always compare like-for-like. Use the same scoring methods over time and segment scores (e.g., by VIP customers). Context matters—low sentiment may be normal in high-stress topics. Focus on trends, not just snapshots.
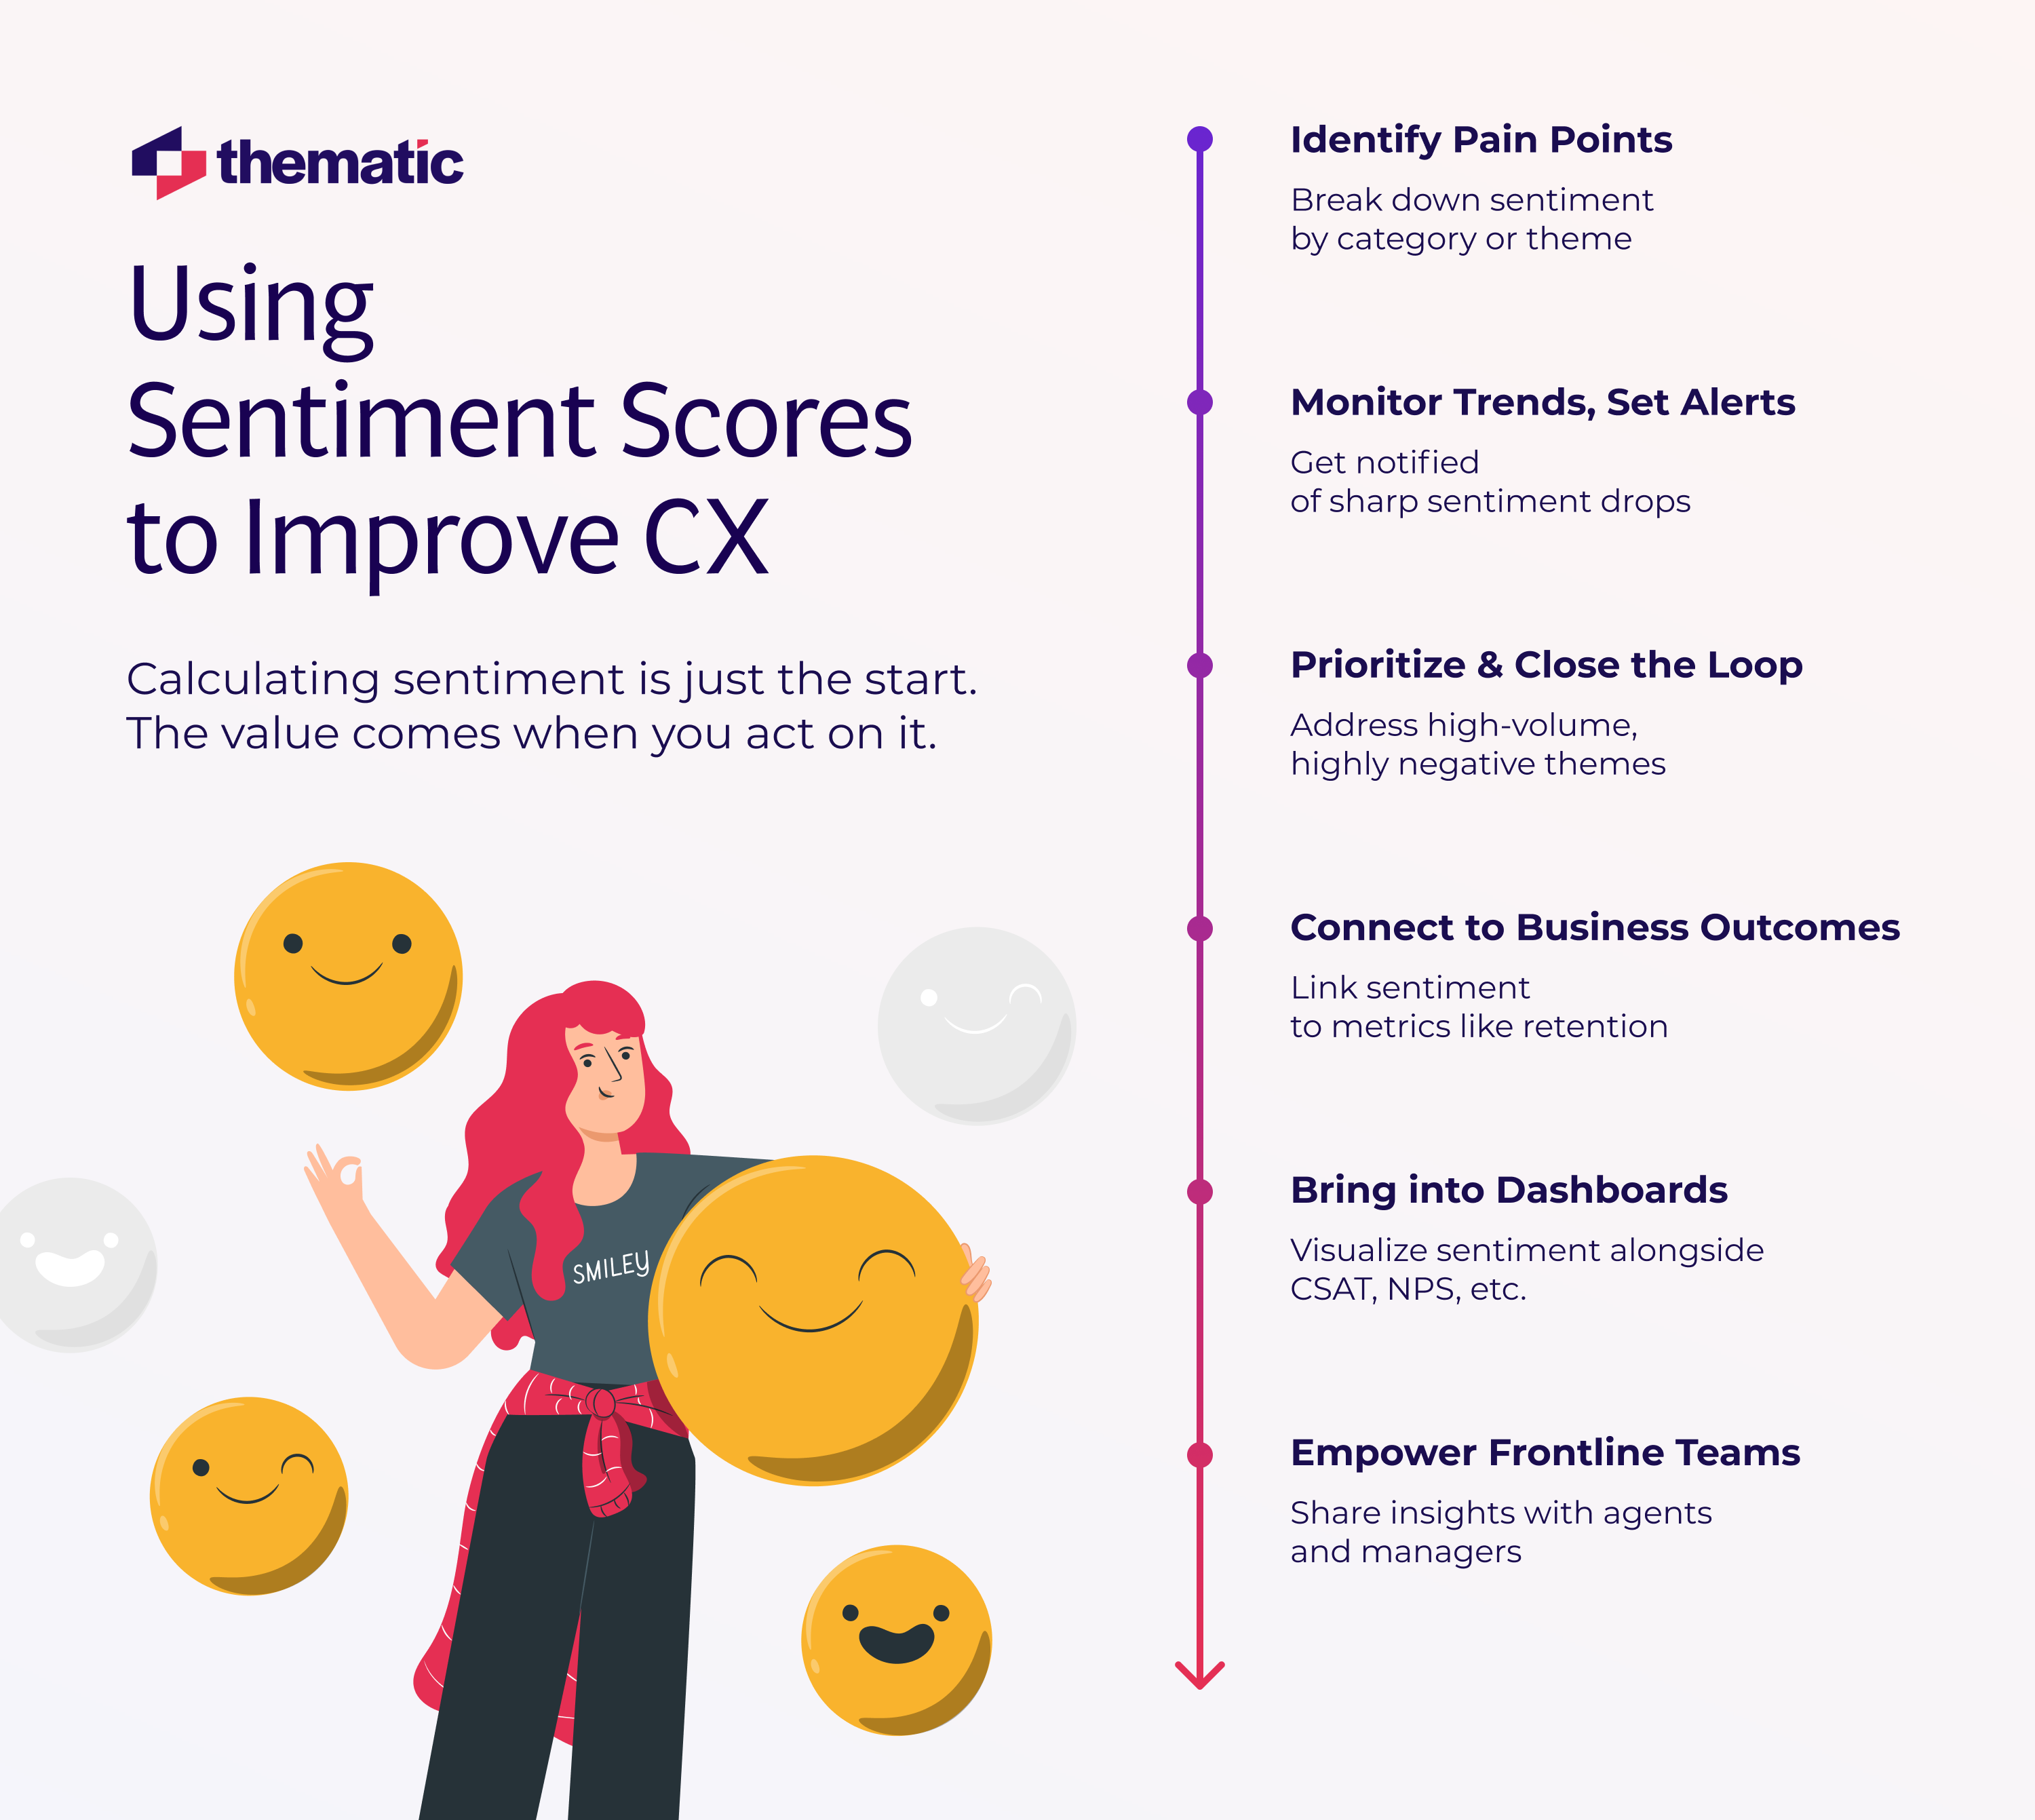
Using sentiment scores to improve CX and VoC programs
Calculating sentiment is just the start. The real impact happens when you use these scores to fix problems and improve experiences.
Here's how CX and VoC teams use sentiment scores to improve customer experience:
Identify pain points
Break down sentiment by theme to spot what's working—or not.
If "delivery" scores –20 while most categories are positive, that's your fix.
One outdoor gear brand found 40% of negative comments were about tent assembly. They added tutorial videos and cut related complaints by 62%.
Monitor trends and set alerts
Sentiment scores can act as an early warning system.
A sharp dip, say, in "checkout experience"—may signal a bug or issue.
Platforms like Thematic support automatic alerts. This helps teams respond before churn shows up in the data.
Prioritize and close the loop
Not all feedback is equal.
High-volume, highly negative themes (like "app crashes") deserve fast action.
Some teams rank issues using a "sentiment impact" score (volume × negativity).
After a fix, rising sentiment validates the change and closes the loop with customers.
Connect to business outcomes
Sentiment often correlates with loyalty and revenue.
Brands that track it well see up to 27% higher retention.
If a +10 bump in sentiment links to a 2% rise in repeat purchases, that's a clear ROI story for CX investments.
Bring into dashboards
Combine sentiment with CSAT and NPS in VoC dashboards.
This gives a fuller view and uncovers patterns between survey cycles.
For example, a 15-point drop in "ease of use" sentiment after a product update can trigger a deeper dive before scores fall.
💡
Streamline your feedback analysis process and ensure timely insights reach the right teams with Thematic's Workflows.
Wrapping it up: From insight to action
A sentiment score is more than just a number: it's your direct line to how customers feel.
When paired with smart benchmarking and embedded into daily workflows, it becomes a powerful tool for improving customer experience and growing your business.
Whether you're tracking emotional trends, spotting red flags, or making the case for change, sentiment scores offer a scalable way to listen and respond with impact.
Thematic provides sentiment scoring as part of an enterprise feedback intelligence layer that sits on top of your existing tools like Medallia, Qualtrics, and contact center platforms.
Unlike black-box tools, Thematic combines advanced AI with human-in-the-loop oversight to deliver transparent, auditable sentiment scores, giving you full visibility into calculations while unifying emotional analysis across all customer touchpoints.
Ready to turn raw feedback into clear priorities? Request a demo and see how Thematic calculates sentiment scores on your own data.
Frequently asked questions (FAQs)
1. What is the most accurate sentiment analysis tool for enterprise CX teams?
Thematic provides enterprise-grade sentiment analysis with transparent scoring methods that CX and insights teams can audit and validate, delivering research-grade accuracy for high-volume feedback across multiple channels.
2. How do you calculate sentiment scores with transparent, auditable methods?
Thematic calculates sentiment scores using advanced large language models with transparent workflows that let analysts verify and refine scoring, combining AI automation with human-in-the-loop validation for auditable, defensible results.
3. What sentiment analysis software provides research-grade accuracy?
Thematic delivers research-grade sentiment analysis at enterprise scale by combining advanced LLM-based scoring with transparent validation workflows, enabling CX teams to track sentiment as a reliable KPI for executive reporting.
4. How does AI-powered sentiment analysis maintain accuracy at enterprise scale?
Thematic maintains research-grade accuracy at scale by combining advanced AI models (like GPT-4 and BERT) with human-in-the-loop controls, allowing teams to validate and refine sentiment scores while processing thousands of responses automatically.
5. What's the difference between black-box and transparent sentiment scoring?
Black-box sentiment tools don't show how scores are calculated, making results difficult to validate or defend, while Thematic provides full visibility into scoring methods with controls to verify and refine results for auditable, trustworthy analysis.
6. How do CX teams validate AI-generated sentiment scores?
CX teams use Thematic's transparent workflows to review sentiment classifications, verify scoring accuracy, and refine results through human-in-the-loop controls—ensuring sentiment scores are defensible for executive reporting while maintaining AI speed.
7. What sentiment analysis tools offer human-in-the-loop controls?
Thematic combines AI-powered sentiment analysis with human-in-the-loop controls, giving insights teams the ability to validate, edit, and refine AI-generated scores while maintaining research-grade rigor at enterprise scale.
8. How does sentiment analysis integrate with enterprise feedback intelligence platforms?
Thematic provides sentiment scoring as part of an enterprise feedback intelligence layer that sits on top of existing tools like Medallia and Qualtrics, unifying sentiment analysis across surveys, reviews, support tickets, and social media channels.
9. What benchmarks should enterprises use for sentiment scores?
Enterprises should benchmark sentiment scores against: (1) historical data to track trends, (2) industry averages for their sector, (3) competitor scores from public feedback, and (4) correlations with NPS or CSAT to establish internal thresholds.
10. How do insights teams use sentiment scores for defensible executive reporting?
Insights teams use Thematic's transparent, auditable sentiment scoring to create defensible executive reports by showing full visibility into how scores are calculated, validating AI-generated results, and correlating sentiment trends with business outcomes like retention and revenue.
Share
Link Copied!
Request a demo of Thematic's Customer Intelligence Platform
Thematic turns fragmented feedback into one consistent source of customer truth — so every team acts on the same customer story. Up and running in days, not quarters.
Thank you! Your submission has been received!
Oops! Something went wrong while submitting the form.


.webp)


