
Thematic's analysis suite makes it easy to combine your unstructured feedback and quantitative data - for insights on how to improve experiences, product and any metric that mattters. With clear priorities in hand, teams know exactly where to focus to improve scores faster.
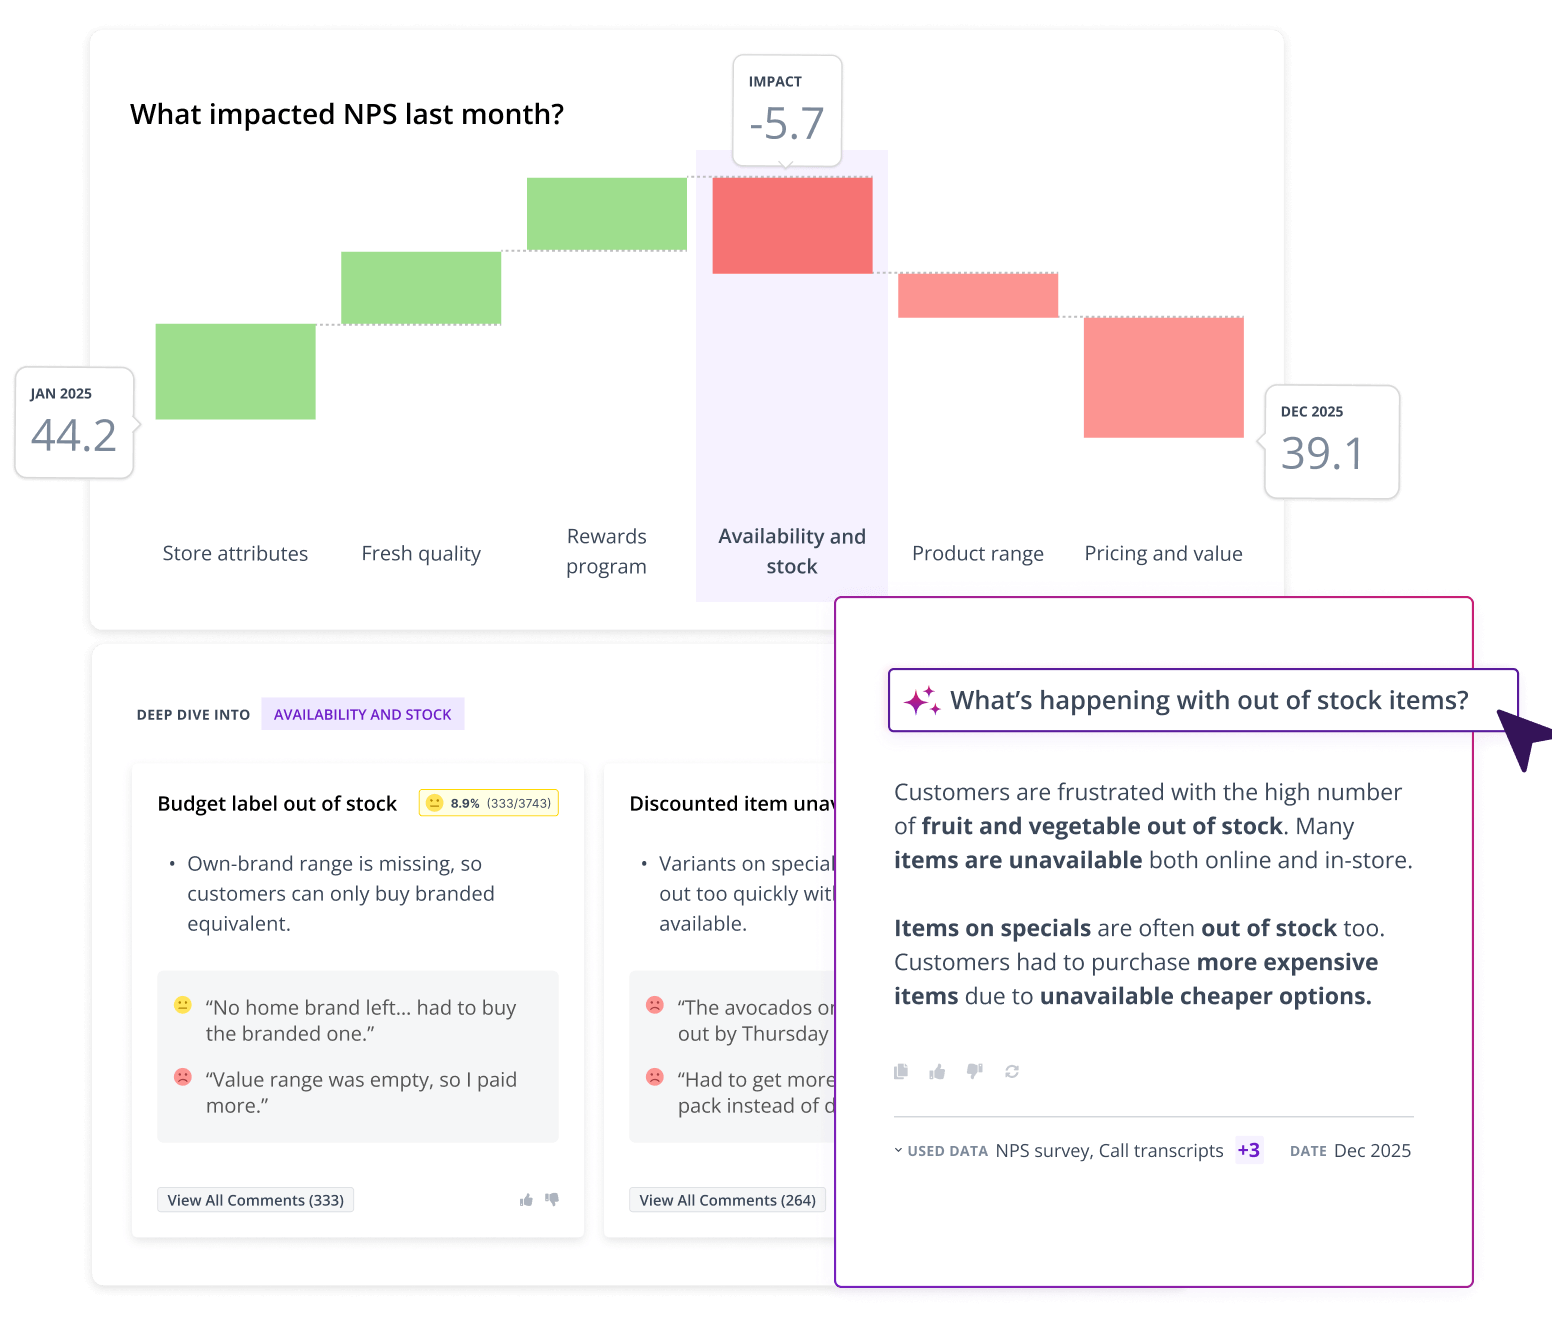


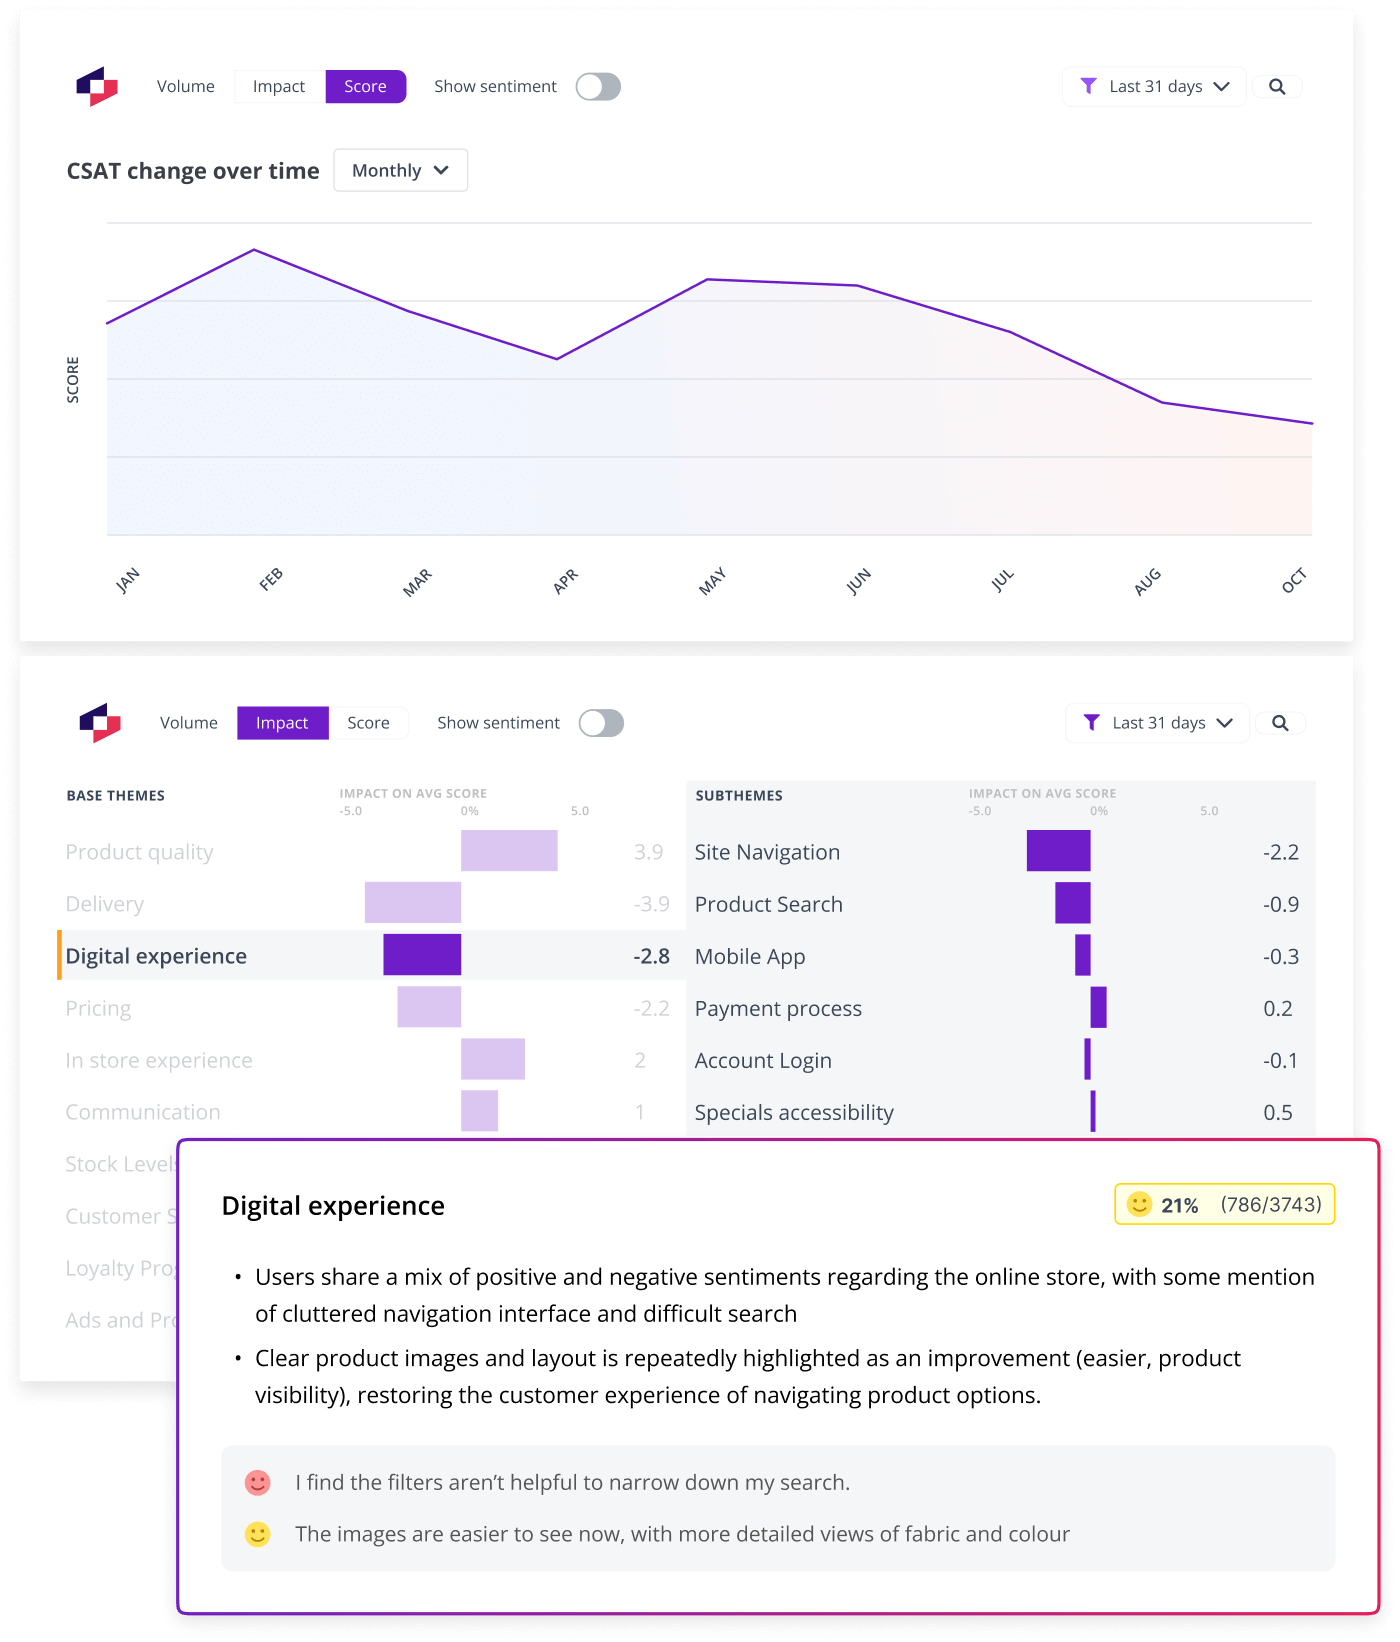
Don’t get distracted by feedback noise. Thematic helps you identify the impact of themes and subthemes on performance metrics, see how they are improving or slipping over time, and drill down for rich context — so your team can quickly align on which actions matter most and why.
With Thematic we can see exactly how the initiative impacted feedback. Not only in overall sentiment but also in the retention metrics. And that helps us think about how to build new features
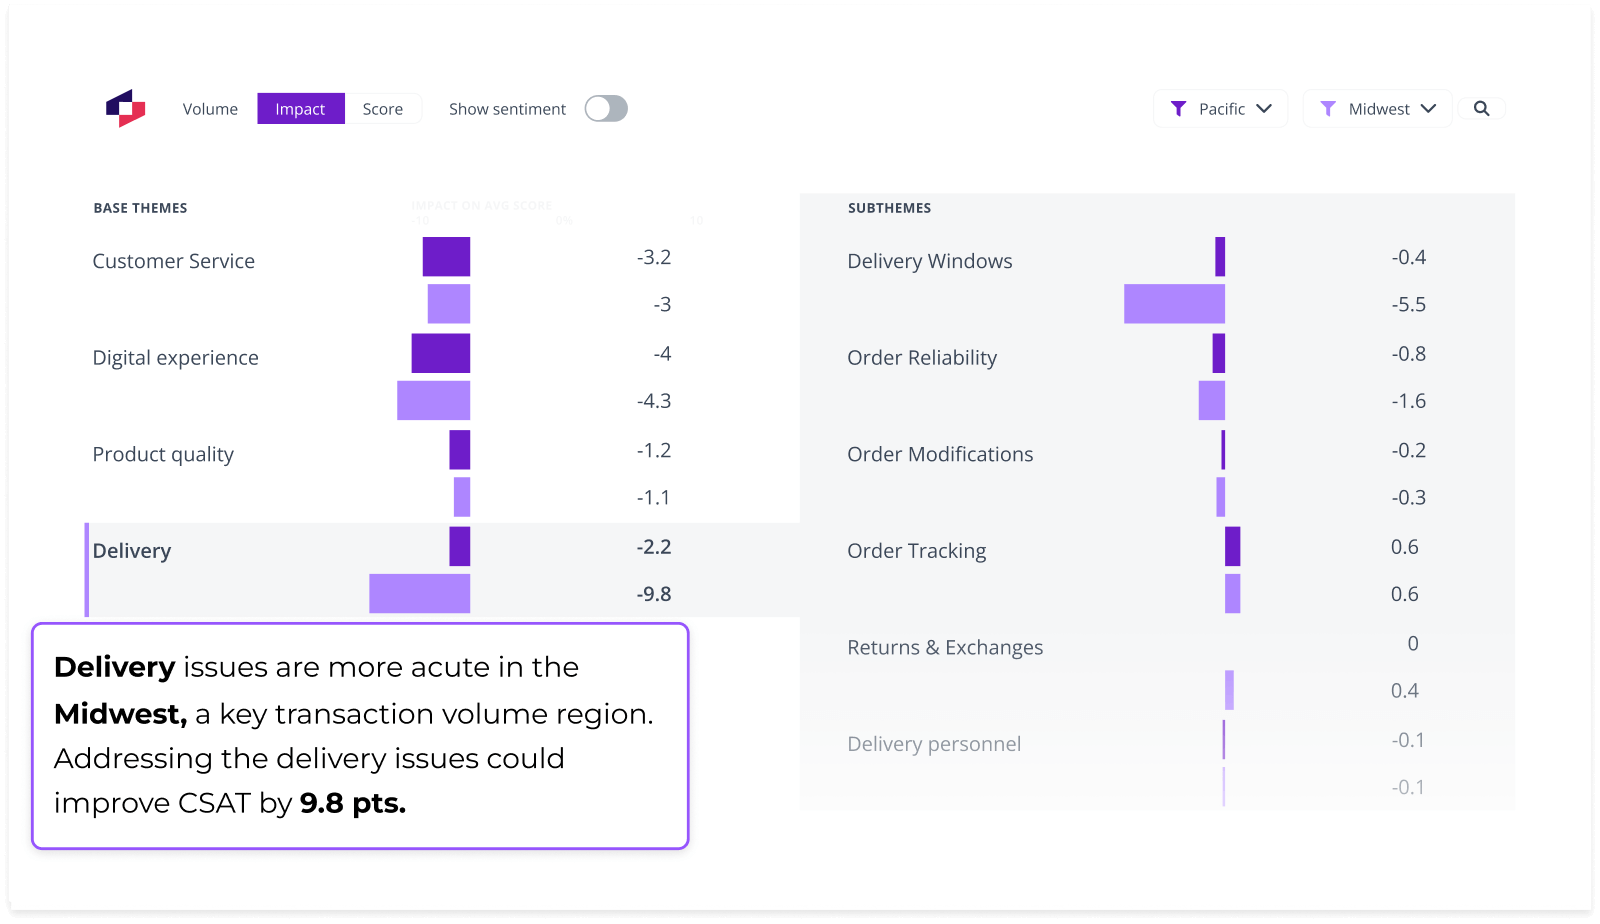
Use filters to explore themes, impact and trends to prioritize improvements for specific customer groups. Make CX real to each team and help them know which aspect of the journey they own.
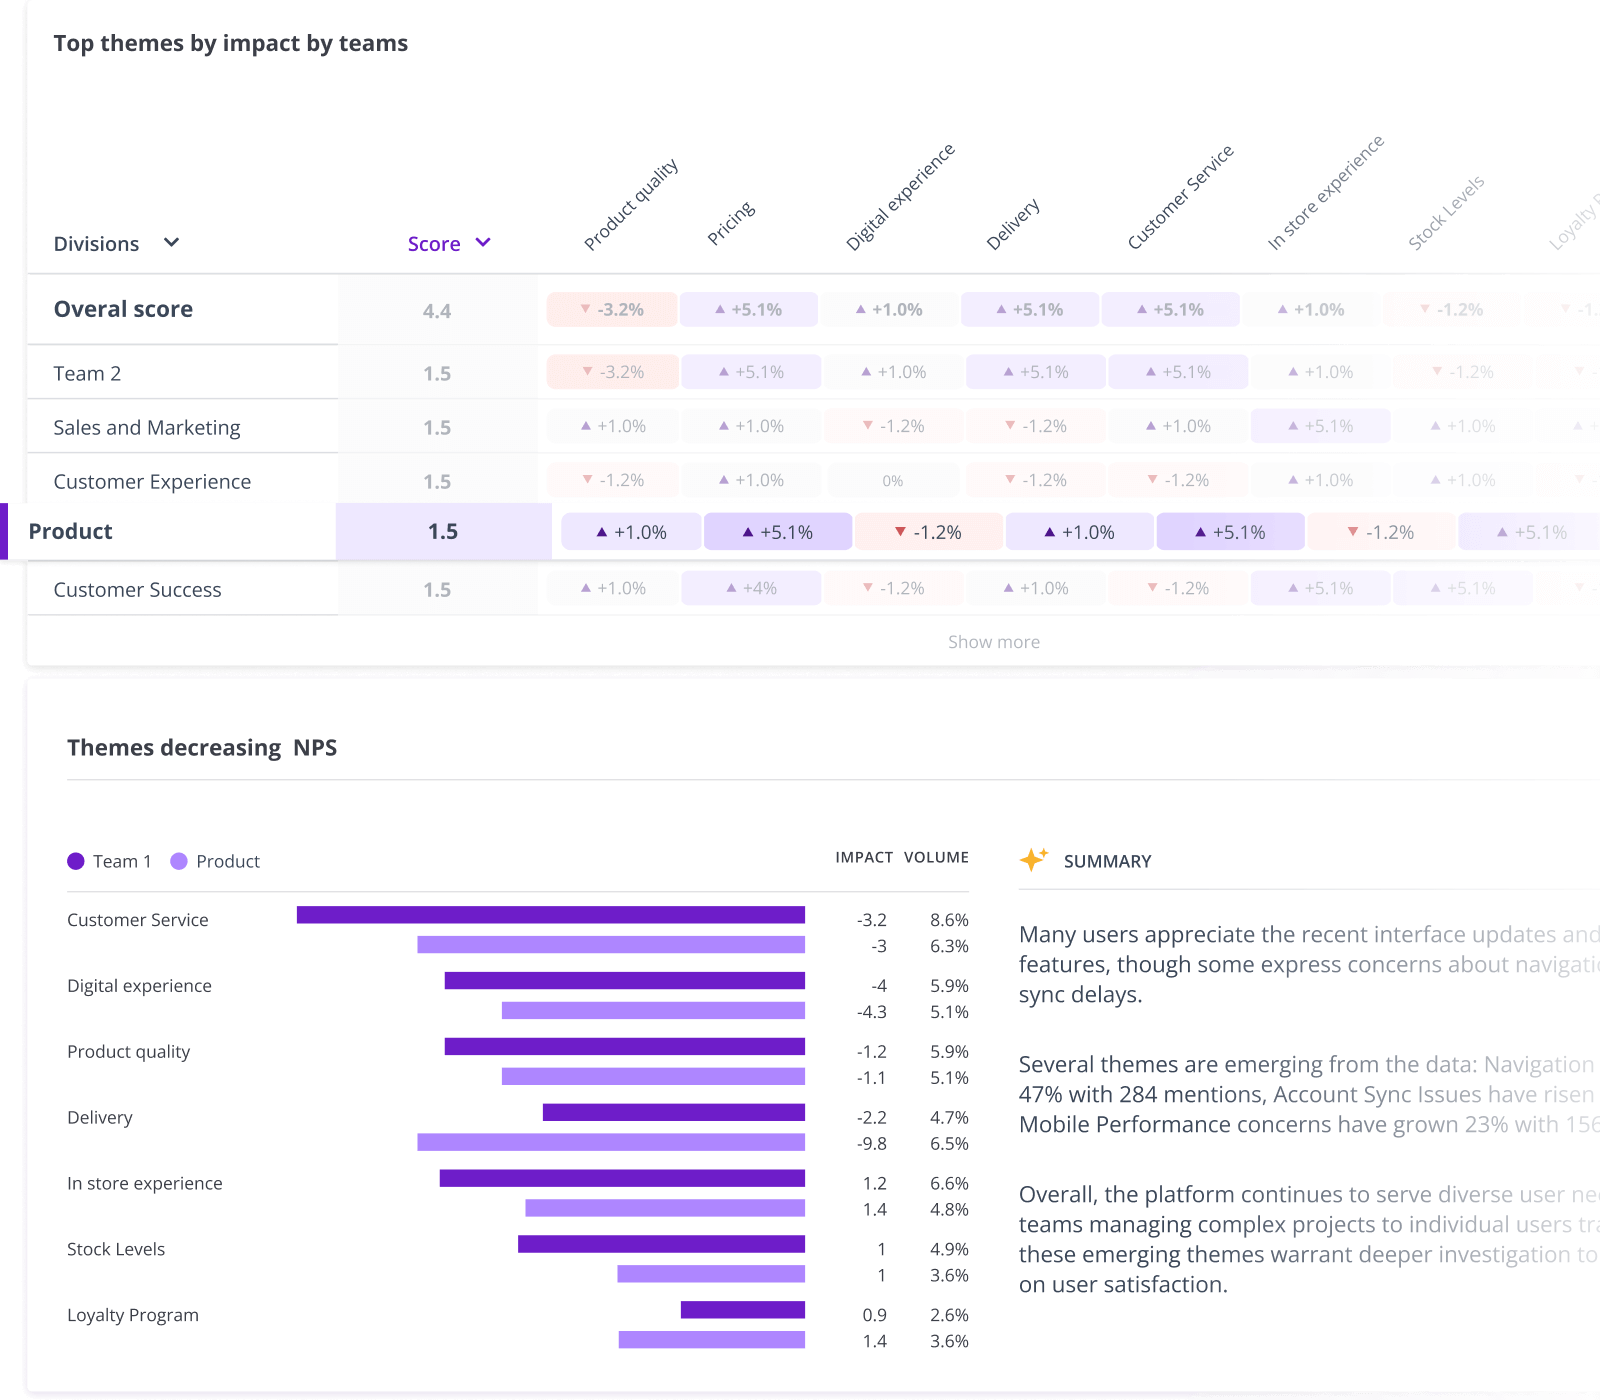
When feedback piles up, it’s hard to know what’s broken and who’s involved. Thematic’s HeatMap reveals feedback themes that matter for each product feature, customer segment or location - so you can drive accountability where needed and then build empathy to take action.
Prior to Thematic, it was a constant struggle for us to make sense of open-ended data, as well as being time-consuming. Now, we can efficiently create audience-dependent insights which add value right across the business.
Alison Schoerman, LinkedIn
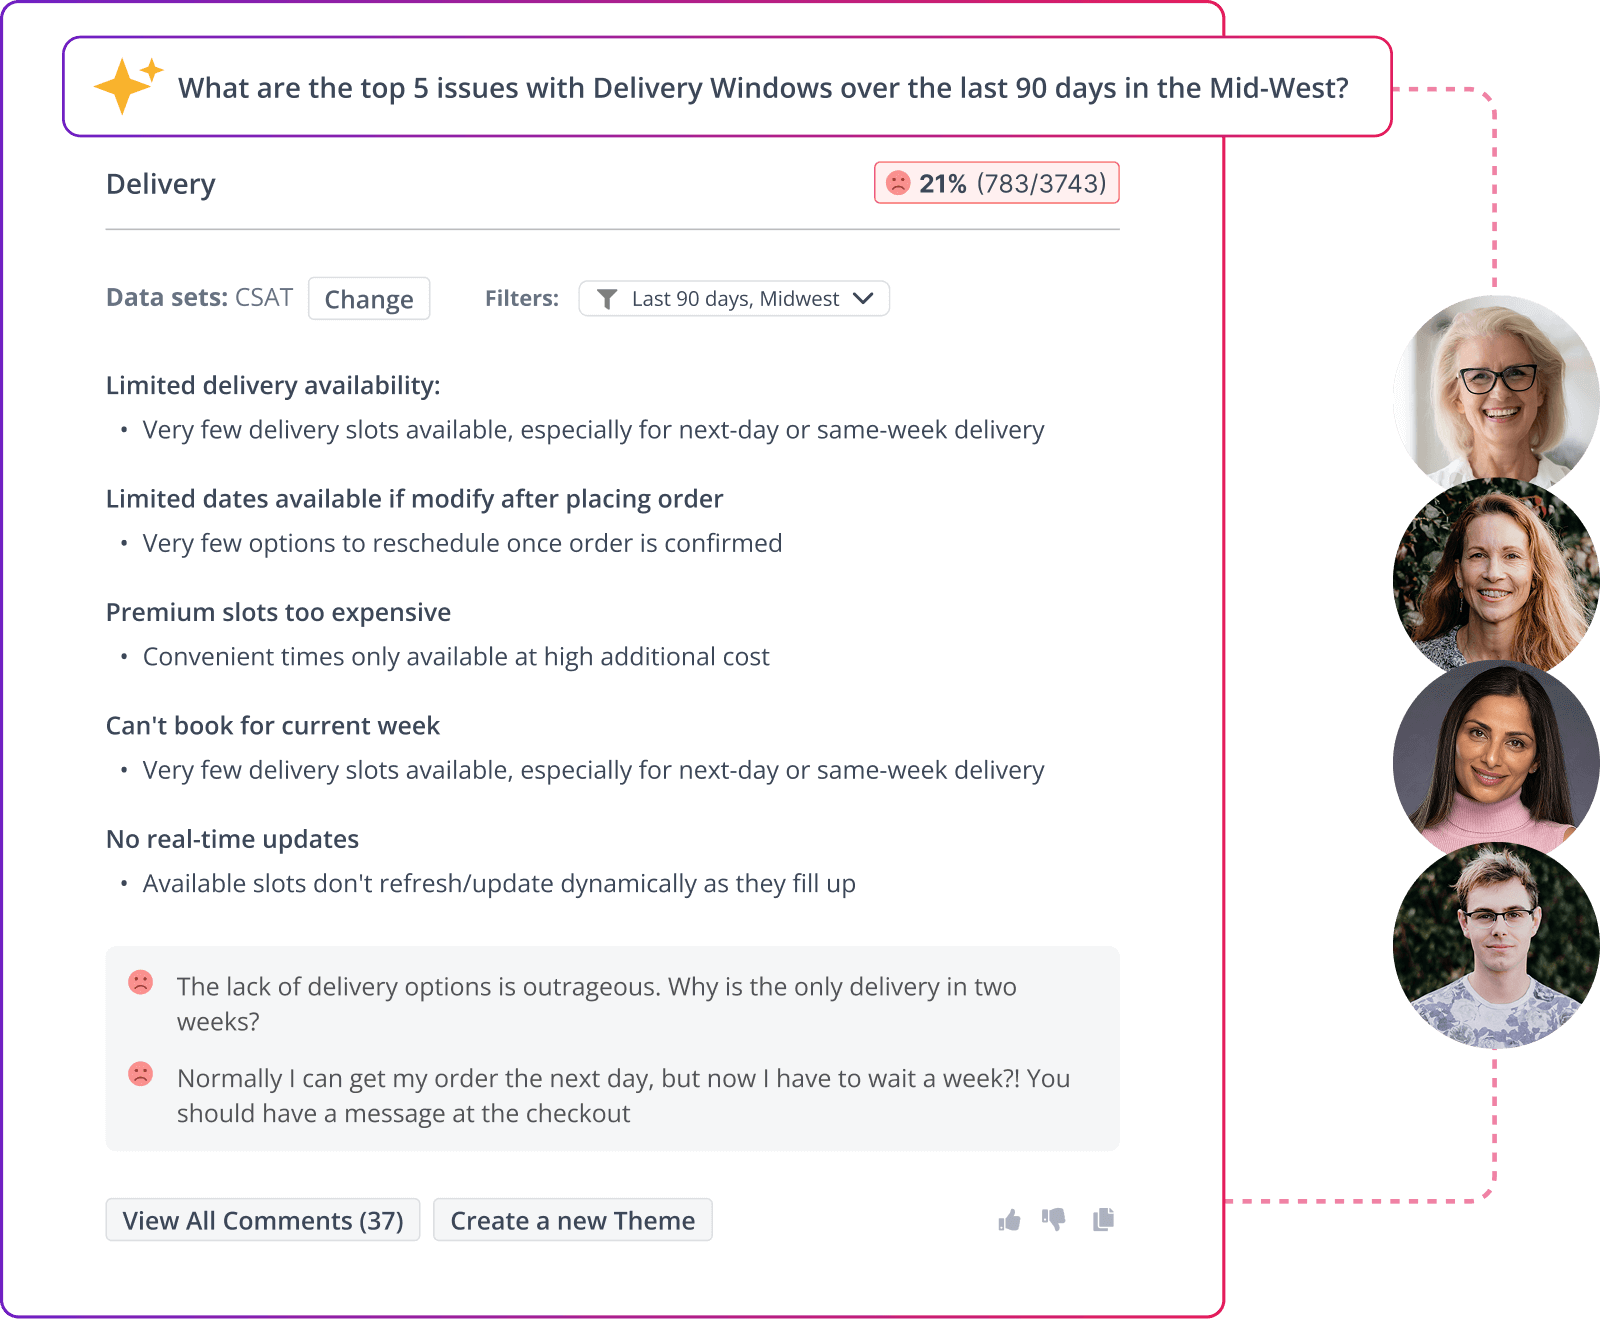
Get reliable and detailed summaries across the platform, to explain any data point. Or use Thematic Answers to ask questions and it automatically applies the right filters, delivering results grounded in the right verifiable data.


