
Power BI vs Tableau: What’s The Best Data Visualization Tool?
Microsoft Power BI and Tableau are both powerful business intelligence tools for data visualization. At first glance their functionality and features might look very similar. So, how do you know which is the best solution for your business?
In this article we’ll reveal what data analysts really think about these two popular business intelligence tools. We’ve analyzed over 2,300 reviews by Tableau and Power BI users with our proprietary text analytics solution Thematic. Read on for some real answers to the age-old Power BI vs Tableau debate.
What is Power BI?
Power BI is a cloud-based suite of business intelligence and data visualization tools which started out as an add-on to Excel. It’s self-declared mission is to “create a data-driven culture with business intelligence for all”. To do this Power BI uses Microsoft systems like Excel, Azure, and SQL, making it an easy win for those already using Microsoft products. The platform has over 100 connectors and has drag-and-drop capabilities which makes it easy to use.
Power BI Desktop
Power BI Desktop is a free data analysis tool that can connect to over 70 on-premises and cloud data sources. Reports created on Power BI Desktop can be shared on the Power BI Microsoft-hosted cloud service. Users can easily access reports and data analysis on the move via a mobile app using Power BI Mobile or a web browser.
Power BI Pro
Users can also opt for Power BI Pro which is a premium cloud-based bi tool with monthly pricing of $9.99 per user. The key benefit of Power BI Pro is the ability to share and collaborate on data visualizations with other Power BI subscribers.
Power BI Premium
Power BI Premium is an even more powerful package costing $20 per month per user. It offers greater flexibility to publish reports across a business without the need for multiple individual licenses. Users can also maintain business intelligence assets on-premises with the Power BI Report Server.

What is Tableau?
Salesforce’s Tableau describes itself as “the most beloved modern analytics platform in the world”. It was the first BI vendor to add data visualization to its BI tool. It’s best known in the industry for its good-looking data visualizations and can handle larger volumes of data with better performance. Their free tool Tableau Public has limited capabilities, but there are a number of pricing options to suit most corporate budgets.
Tableau Creator
Users need to pay for Tableau Creator if they want to connect to mobile apps like Hadoop, Google Analytics or Microsoft products. There is also the cheaper Tableau Explorer plan for those using existing dashboards only.
Tableau Desktop
Users can get Tableau Desktop as part of Tableau Creator. Tableau Desktop allows you to install the software directly on your desktop. It allows you to access huge datasets on your laptop using advances in databases and computer graphics technology. Users can easily explore datasets live or in-memory.
Tableau Online
Tableau Online uses a Tableau-hosted site and works best for new users. This allows you to securely publish data and access your content from anywhere.
Tableau Server
Tableau Server can be installed on-premises on Windows or Linux for organizations who want more control over their data. Those who need to access Tableau Server on the move can use Tableau Mobile to seamlessly access their data visualizations on mobile devices.
Power BI vs Tableau: Frequently Asked Questions (FAQs)
What is more popular, Power BI or Tableau?
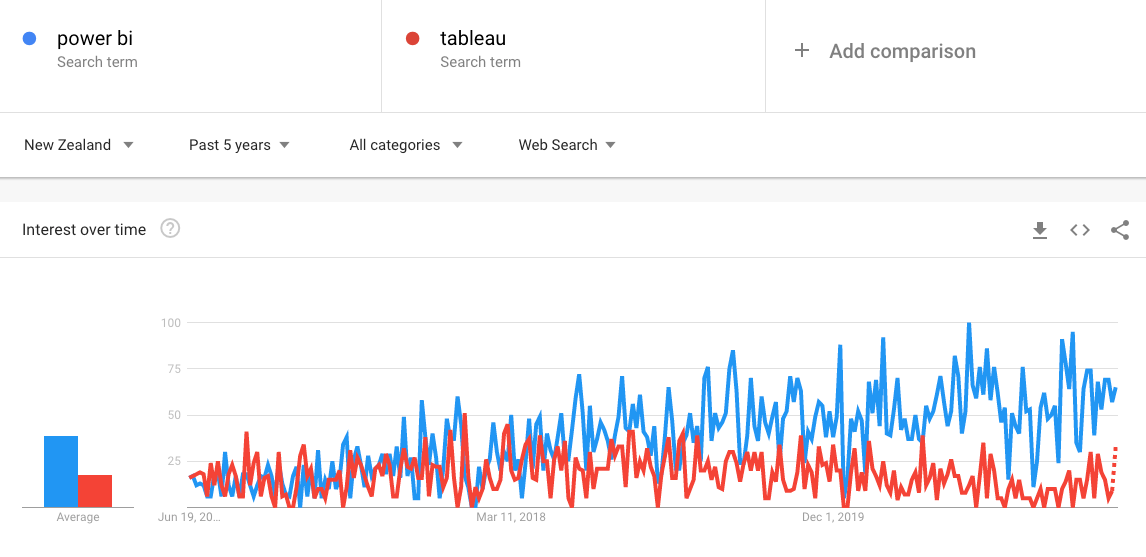
According to Slintel, as of June 2021 Tableau has a market share of 12.97% with 31,568 companies using it, whereas Power BI has a market share of 5.43% with 13,201 user companies. It’s worth bearing in mind that Power BI was launched 12 years later than Tableau (in 2015), and it has rapidly gained market share thanks to its ease of use and Microsoft credentials. Google search term analysis shows that there are now over twice as many Power BI searches compared to Tableau searches.
Which tool can you use to create a visual dashboard?
Both Tableau and Power BI can both be used to create visual dashboards to display data visualizations from different reports. Tableau is known for its visually attractive dashboards which can be built easily by drag and drop. Creating dashboards is also simple with Power BI which uses tiles, or visualized metrics which link directly to reports and datasets. Users can easily pin tiles from a particular report to appear on a dashboard.
Which tool is easier to use?
Power BI is generally considered easier to use for newer users and those who are not data analysts. Tableau is more popular with experienced data analysts, as it's known to have a steeper learning curve. Check out our analysis of user reviews below for perceptions on both tools strengths and weaknesses.
Which company was founded first?
Tableau was founded in 2003 and was recently acquired in 2019 by Salesforce. Power BI is a much newer player in the market and was unveiled by Microsoft in 2013. After a couple of years of internal usage, Microsoft only made Power BI available to the public in 2015.
How much do Power BI and Tableau cost?
Power BI generally works out cheaper than Tableau and even has a free version available for individual use. Their Pro paid plan costs $9.99 per month per user. Tableau’s equivalent package starts at $70 per month per user. See below for more in-depth analysis of the pricing structures of Power BI and Tableau.

Power BI vs Tableau: What do the experts say
Technology Advice
Directly comparing Power BI and Tableau, a 2021 review from Technology Advice concludes that “Power BI wins for ease of use, but Tableau wins in speed and capabilities”. Power BI has the edge over Tableau with its real time data which means “teams can react instantly to business changes fed to Power BI from the CRM, project management, sales, and financial tools.”
On the other hand Tableau has the advantage over Power BI when it comes to “live query capabilities and extracts, which is particularly helpful for data analysts who are used to stopping all work for the query process.” Overall, the reviewer notes that “Tableau lives somewhere in between query-based (and developer-dependent) data visualization and drag and drop.”
PCMag
In 2018 Microsoft’s Power BI earned a rave review from PCMag with an overall score of 4.5/5 and an Editors’ Choice honor. The analysis praised Power BI’s “user-friendly user interface (UI) and remarkable data visualization capabilities”. Negative points were that the “desktop and web versions divide data prep tools” and the free version is fairly limited. Overall the platform was “one of the best BI tools on the market” with a “wealth of data source connectors”.
In 2018 Tableau was also awarded an Editors’ Choice honor by PCMag and picked up an excellent score of 4.5/5. It was lauded as “one of the most mature offerings on the market” with an “enormous collection of data connectors and visualizations”. The only major drawback noted in this review was that it's hard to use for non data analysts.
Better Buys
Better Buys criticized Power BI’s interface for being “challenging for new users to learn at first” in 2021. But overall the platform was described as “similar to Excel with the ability to create and import simple visuals”. It was praised for giving “full visibility of business performance” and bringing together “disparate data”.
Similarly, a 2021 review of Tableau on Better Buys cited the “steep learning curve for executives” as a negative feature. It also noted that “the system tends to be slow at times when dealing with large datasets”. On the positive side, Better Buys reported that Tableau’s “visualization tools make data approachable for all types of users” and praised its “simple drag-and-drop features”.
Power BI vs Tableau: Thematic analyzes public reviews
Experts’ opinions are interesting, but what do real users think? Various public sites have public reviews where users candidly speak about the pros and the cons of Power BI and Tableau. We have gathered over 2300 such reviews to provide deeper insight into this comparison.
Using Thematic’s proprietary feedback analytics solution we crunched this data. While ratings can be used to measure customer satisfaction with Power BI and Tableau, Thematic quantifies what’s driving these ratings.
How Thematic works
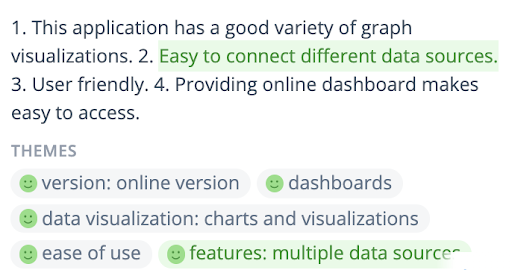
Thematic’s advanced AI discovers “themes” in customer reviews. For example, the screenshot below shows five themes which capture the positive features of one of the platforms: charts and visualizations, multiple data sources, ease of use, an online version and dashboards. Thematic aggregates these themes into trends and compares Power BI and Tableau side by side. Thematic also gives each theme a sentiment score. If you’d like to try Thematic on your own feedback, there is a free trial.
In the following analysis of customer reviews on Power BI and Tableau, we’ll refer to “volume” as the percentage of reviewers that mention a particular theme. This gives a strong indication of which features and characteristics are most important to users of Power BI and Tableau.
How are Power BI and Tableau used?
Analysis of the feedback data shows that Tableau users are more likely to talk about creating data visualizations. Power BI users are more likely to mention reporting and sharing data. This suggests Power BI users tend to use the platform to create reports and share them with stakeholders.
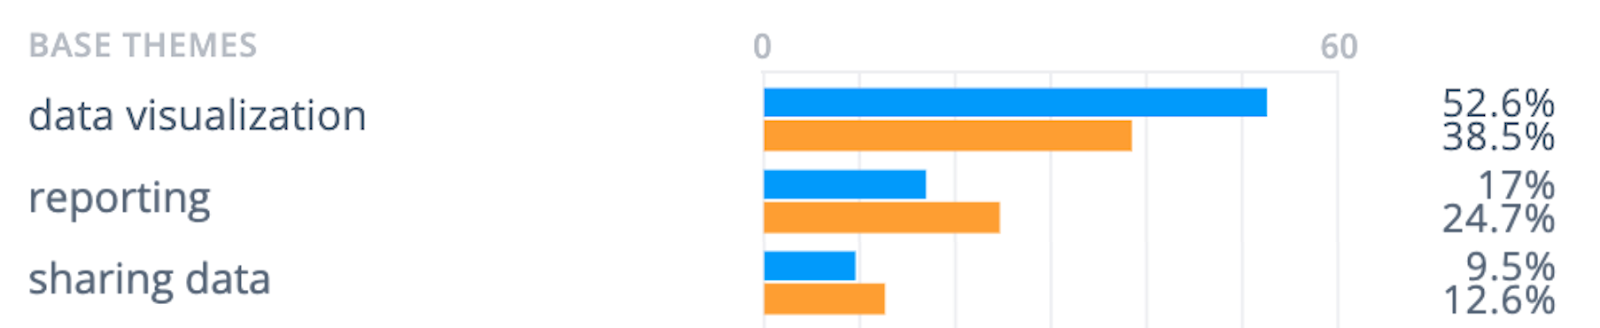
Winner: Tie!
While Tableau wins purely on its stunning data visualizations, Power BI is more often used for reporting and sharing data.
Microsoft and Power BI
Another key advantage that Power BI has is the fact it's owned by Microsoft. 4% of reviewers mention this in their feedback. Power BI has great connectivity with other Microsoft products and is easier to use if you’re already familiar with the Microsoft family of products.
Winner: Power BI
Power BI’s link to Microsoft gives it an edge over other analytics tools. Tableau also has big name backing, though, since it was purchased by Salesforce in 2019.
Pricing
Power BI has the edge over Tableau when it comes to pricing. Power BI Pro costs just $9.99 per month per user and the even more powerful Power BI Premium costs $20 per month per user.

More than 8% of users cite pricing as one of Power BI’s biggest strengths. Power BI users find that its cost is often included in the Microsoft subscription package, there is a free version, and users often specifically comment that it’s cheaper than Tableau:
“Power BI is part of a Microsoft Office 365 subscription package for businesses and you only need to pay an additional 15USD/month for each additional admin/analyst account you add. This is a stark contrast to similar solutions like Tableau, which charge a monthly fee for each user and has a minimum user count that equates to roughly a 15,000USD/year license cost as minimum.”
In Tableau’s defense, users do note that it has reasonable pricing. It’s fair to small businesses since they charge per seat and they do have student rates.
Users can choose from the full Tableau Creator package at $75 per month or opt for the Tableau Explorer at $35 per month if you only need to use existing dashboards. Users who just need to view and interact with dashboards can get the $15 per month Tableau Viewer subscription.
Winner: Power BI
Power BI’s pricing structure is easier to understand than Tableau. It offers both free and low cost options which are ideal for smaller businesses.
Ease of Use
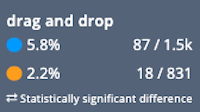
A similar percentage of reviewers comment on ease of use for both Power BI and Tableau, but their feedback diverges when we take a closer look. Users of Tableau were more likely to comment on its drag-and-drop functionality than Power BI.
Overall, Tableau users highlighted more often the ease of creating data visualizations. Power BI users were more likely to note the ease of creating reports. This makes sense given our earlier data analysis showed Tableau is more often used to create data visualizations and Power BI for reporting.
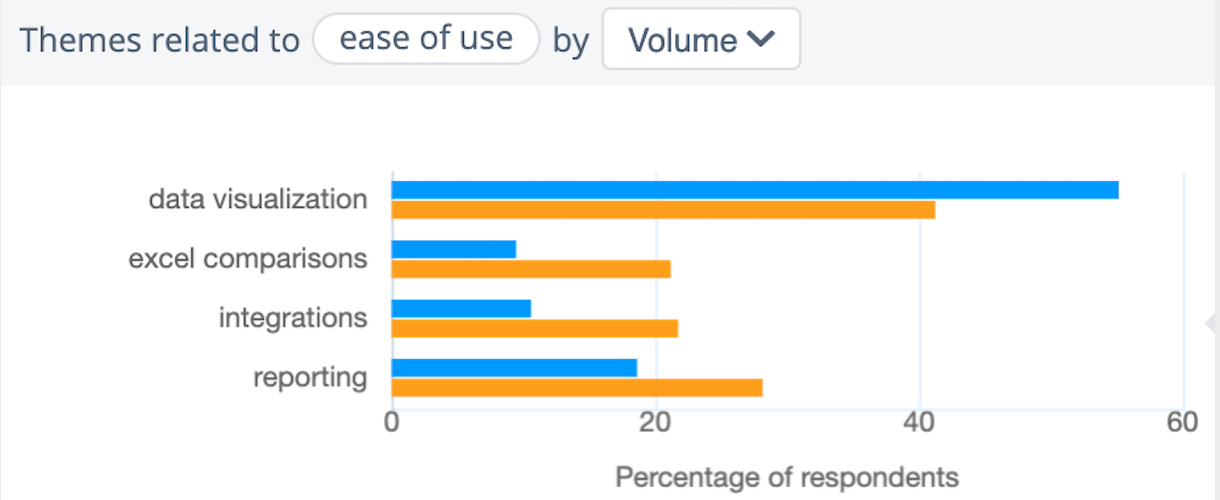
Power BI users were also twice as likely to comment on the ease of working with Excel files, or to compare the ease of working in Power BI to that of Excel. One reviewer even described it as “Excel on steroids”.
Winner: Power BI
Overall Power BI has a slight advantage over Tableau, especially for users who are used to working with Excel and other Microsoft products.
Training
Related to ease of use is the level of training and expertise that’s needed to use the platforms. 29% of Tableau users spoke about the need for training and the steep learning curve compared to 25% for Power BI users.

Tableau users were especially likely to talk about the learning curve. Users of both platforms mentioned the time needed to master them and watching a tutorial to get up to speed.
Winner: Power BI
For those who need to get started quickly and are not data analysts, Power BI is the logical choice.
Integrations
Both SaaS products can easily integrate with most popular third party data sources, allowing you to easily import data from SAP, Google Analytics, MySQL and other databases.
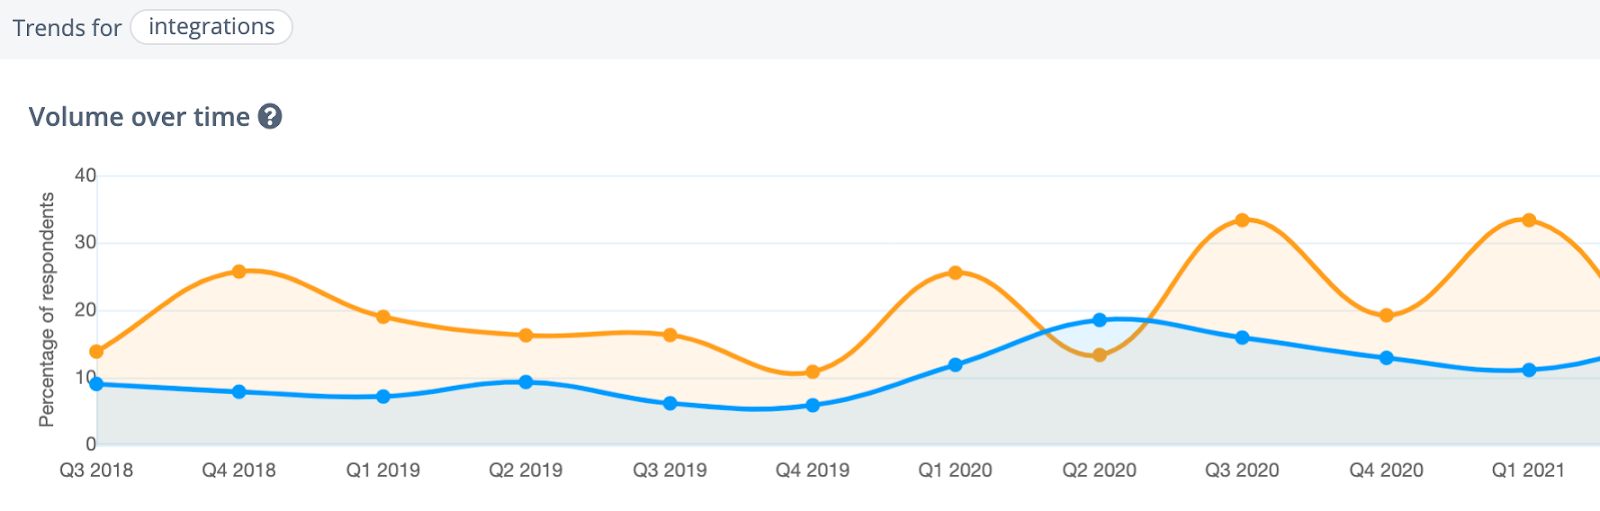
When it comes to integrations, Power BI again comes out on top with 20-30% of reviewers mentioning them. Power BI users are especially likely to mention Office 365, SQL and R Integration when talking about ease of use of working with them. Power BI offers access to many APIs and is constantly unveiling more connectors on a monthly basis.
Tableau respondents were more likely to talk about SQL and R Integration. Tableau’s Connector is generally considered more advanced than Power BI, but users are required to identify the data they want to analyze before making the connection.
Winner: Power BI
Tableau might be more advanced when it comes to integrations, but Power BI gets more positive mentions overall for this feature.
Speed
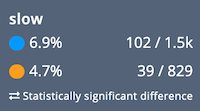
When it comes to speed, Tableau users are slightly more likely to say that the solution is slow. Overall, around 15% of users comment on different aspects of performance such as the speed and the robustness of the solution.
Winner: Power BI
Again, Power BI takes the lead with fewer users reporting a slow service.
Features
Working with multiple data sources
There’s no doubt that when it comes to working with multiple data sources, Power BI comes out on top. Power BI users comment on external data sources you can import to enrich your data, ease of working with on-premise datasets and out-of-the-box imports. Power BI also offers real-time connectivity with big data through streaming data.
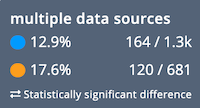
Tableau users also comment on the ease of integrations thanks to the custom connectors available on the platform.
Winner: Power BI
Power BI is the leading data visualization tool when it comes to working with multiple data sources.
Customization
When it comes to customization Tableau has more satisfied users than Power BI. Tableau users specifically comment on customizing and tweaking charts, adding custom calculated fields and formulas, custom interactive dashboards, as well as “pivoting data in endless ways”.
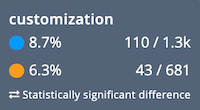
Winner: Tableau
Tableau’s strong customization options wins over Power BI’s more limited offering.
Filtering
Power BI users like the depth of filtering capabilities, allowing them to easily slice and dice data from various data sources. They also like that this functionality is similar to Excel and therefore feels familiar. In fact, almost twice as many Tableau users complain about its filtering functionality compared to Power BI.
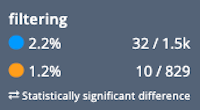
Winner: Power BI
In an easy win, Power BI comes out on top for filtering thanks to its Excel similarities.
Artificial Intelligence and Machine Learning
Another key feature for both Power BI and Tableau is the option to use natural language to ask questions about your data. Power BI has Q&A which allows you to enter a natural language question and get a response in the form of a data visualization of that dataset. Likewise, Tableau has Ask Data which performs a similar function and creates answers in the form of ready-made data visualizations.
Tableau also offers machine learning features including predictive analysis, clustering, and smart recommendations. Meanwhile Power BI’s Azure integration allows users to create machine learning models.
Neither solution is well equipped to deal with text data beyond word clouds. This is where Thematic comes in! It can help turn text data, such as customer feedback, into structured themes by using AI-driven text analytics. It integrates easily with both solutions.
Winner: Tie!
Both Power BI and Tableau offer some machine learning capabilities, although Power BI may appeal more to those familiar with Microsoft products like Azure Machine Learning.
Community forums
Tableau has an active community of more than 220,000 users from the data science world. There’s a large community forum and over 500 global user groups. Tableau also hosts conferences around the world as well as virtual events like the Tableau Live discussion panels. Power BI is more limited when it comes to customer support with a smaller community forum. Power BI does host an annual Power BI Summit with over 100 sessions.
Winner: Tableau
Tableau has been around a lot longer than Power BI and has a dedicated following of data scientists. Its community forum and level of user engagement is much stronger than Power BI.
Power BI vs Tableau: Key Differences
- Tableau is best known for its visually attractive data visualizations whereas Power BI is preferred for its ability to work with multiple data points
- Tableau uses MDX for dimensions or measures while Power BI uses DAX in measures and calculated columns (which affects speed and reporting capabilities)
- Tableau is ideal for experienced data analysts whereas Power BI can be used by both expert and novice users
- Tableau takes time and expertise to master, but Power BI is easier to learn to use
- Tableau can efficiently handle large volumes of data while Power BI is better for limited data volumes
- Tableau’s basic Creator package costs $70 per month per user while Power BI’s equivalent plan is $9.99 per month per user
The power of integrating Thematic with Power BI & Tableau
As mentioned above, neither Power BI nor Tableau support analysis of text data beyond word clouds. But word clouds provide only limited insights: Perhaps the feel for the types of words people use, but not what are they actually saying.
In an ideal world, you want to treat text like numbers. To do this, you need to move from words to themes. For example, regardless of how different people might say "difficult to use" (hard to use, tricky to use, not easy to use), you want to count it as one theme. Then you are able to visualize this data using the same charts as any other numeric data. You've seen the examples of the type of deep analysis and insights on text data in this post.
Thematic allows you to do just that. And while we provide our own visualizations, we recognize that tools like Power BI and Tableau are more powerful. You can pull different types of data into these solutions, you can share dashboards more easily with colleagues. So, we created a Power BI app, and we also make it easy to integrate with Tableau via our API. If you are planning on using Power BI or Tableau to visualize qualitative data, you should check out the existing feedback reporting tools in Thematic.
For powerful text analytics behind your visualizations, try Thematic on your own data.

Conclusion
So, Power BI or Tableau? Which one you ultimately choose simply depends on how you need to use these tools in your business.
In the Power BI vs. Tableau debate the overall winner has to be Power BI. Its ease of use, similarity to Excel, and affordable pricing makes it a great option for many types of businesses.
Tableau still has unique benefits that many businesses and analysts will appreciate. It’s better for larger volumes of data, offers beautiful data visualizations, and greater customization options than Power BI.


